ApexCharts.js: Responsive, Interactive SVG Chart Library for Dashboards and Apps

Turn JavaScript data into responsive SVG charts for dashboards, reports, and analytics, with canvas support for dense series.


Turn JavaScript data into responsive SVG charts for dashboards, reports, and analytics, with canvas support for dense series.

Billboard.js is a simple, reusable, customizable, modular, flexible JavaScript chart library based on the famous D3.js library.

D3 Funnel is a JavaScript library for drawing customizable SVG based funnel charts using D3.js library.

With just a few lines of code, you can generate line, bar, candlestick, and other common financial charts.
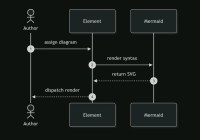
Render Mermaid syntax as SVG from custom HTML elements with dynamic Mermaid loading, local package integration, and Shadow DOM styling.

Turn JSON data into animated canvas charts built from particles, with responsive sizing, live data morphs, and zero runtime dependencies.
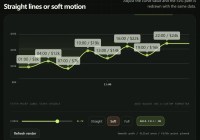
A dependency-free JavaScript chart library for responsive line graphs with custom strokes, points, labels, and fills.

Create stock and crypto price charts with Lightweight Charts v5, including candlesticks, volume, realtime data, markers and chart configuration.

A beautiful, responsive, animated charting & graphing JavaScript library that supports more than 60 chart types.
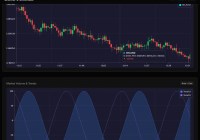
Build smooth, GPU-accelerated charts with ChartGPU. This library handles millions of data points and real-time updates. Native TypeScript support.